
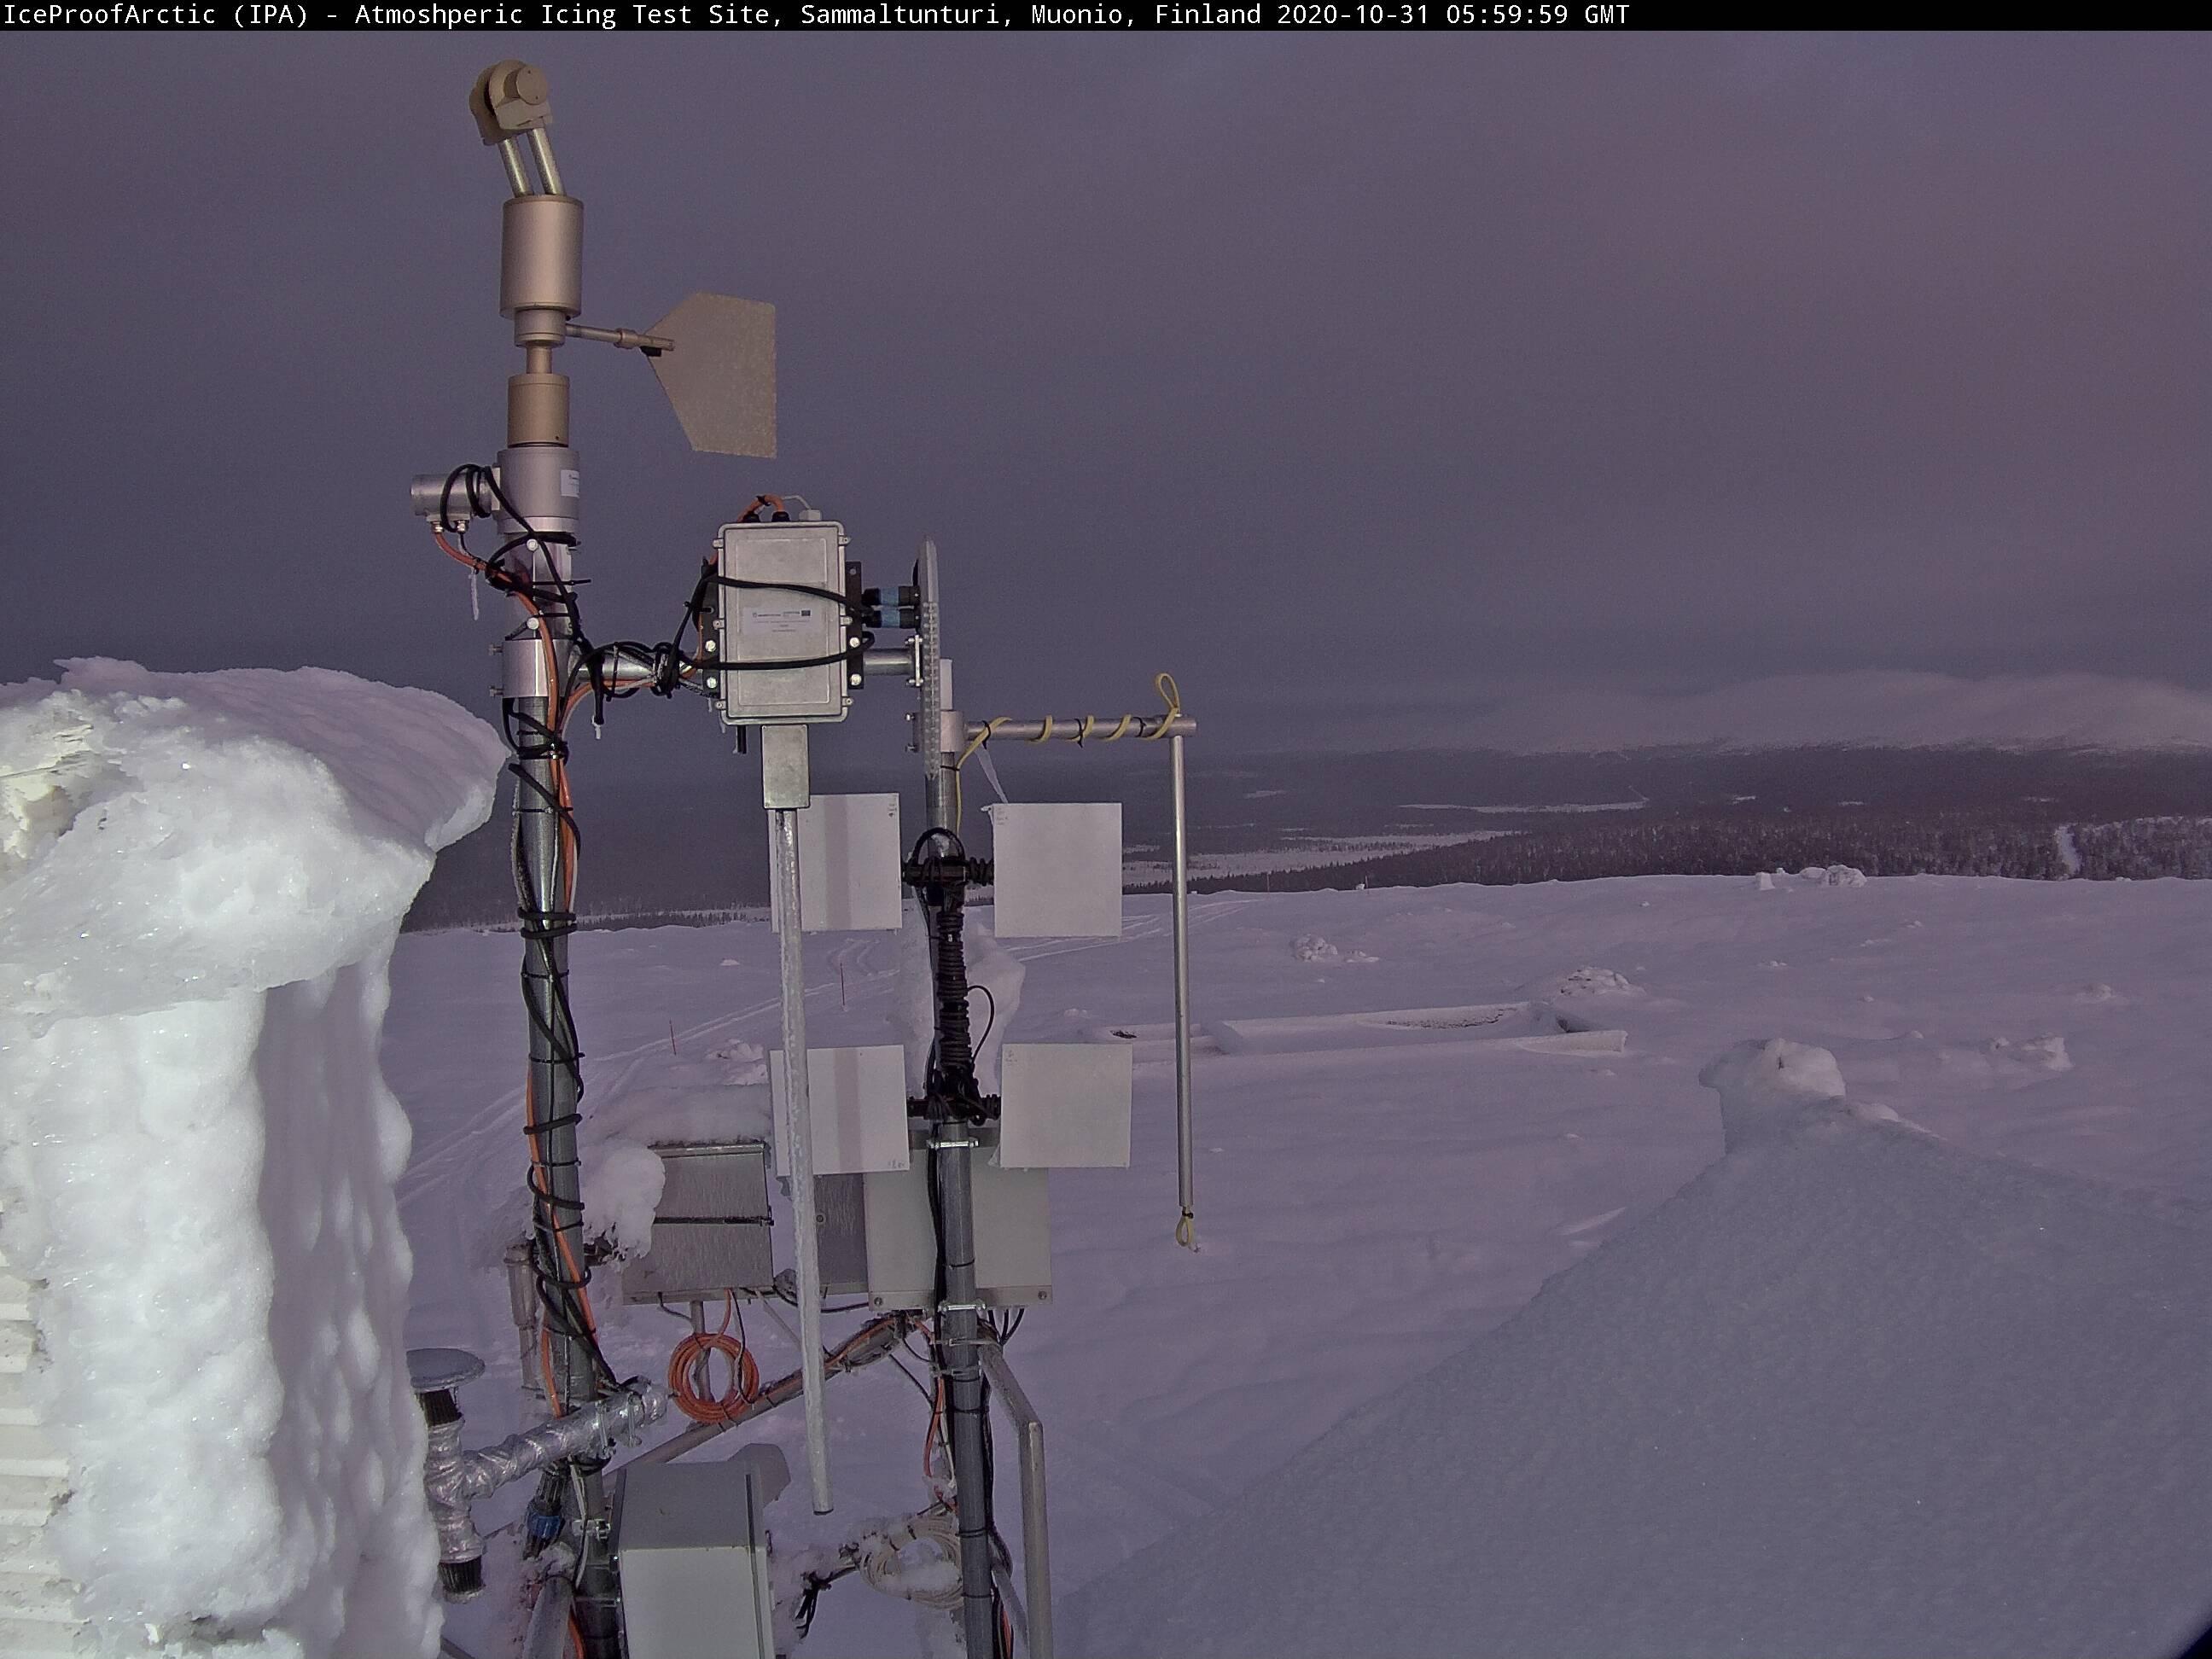
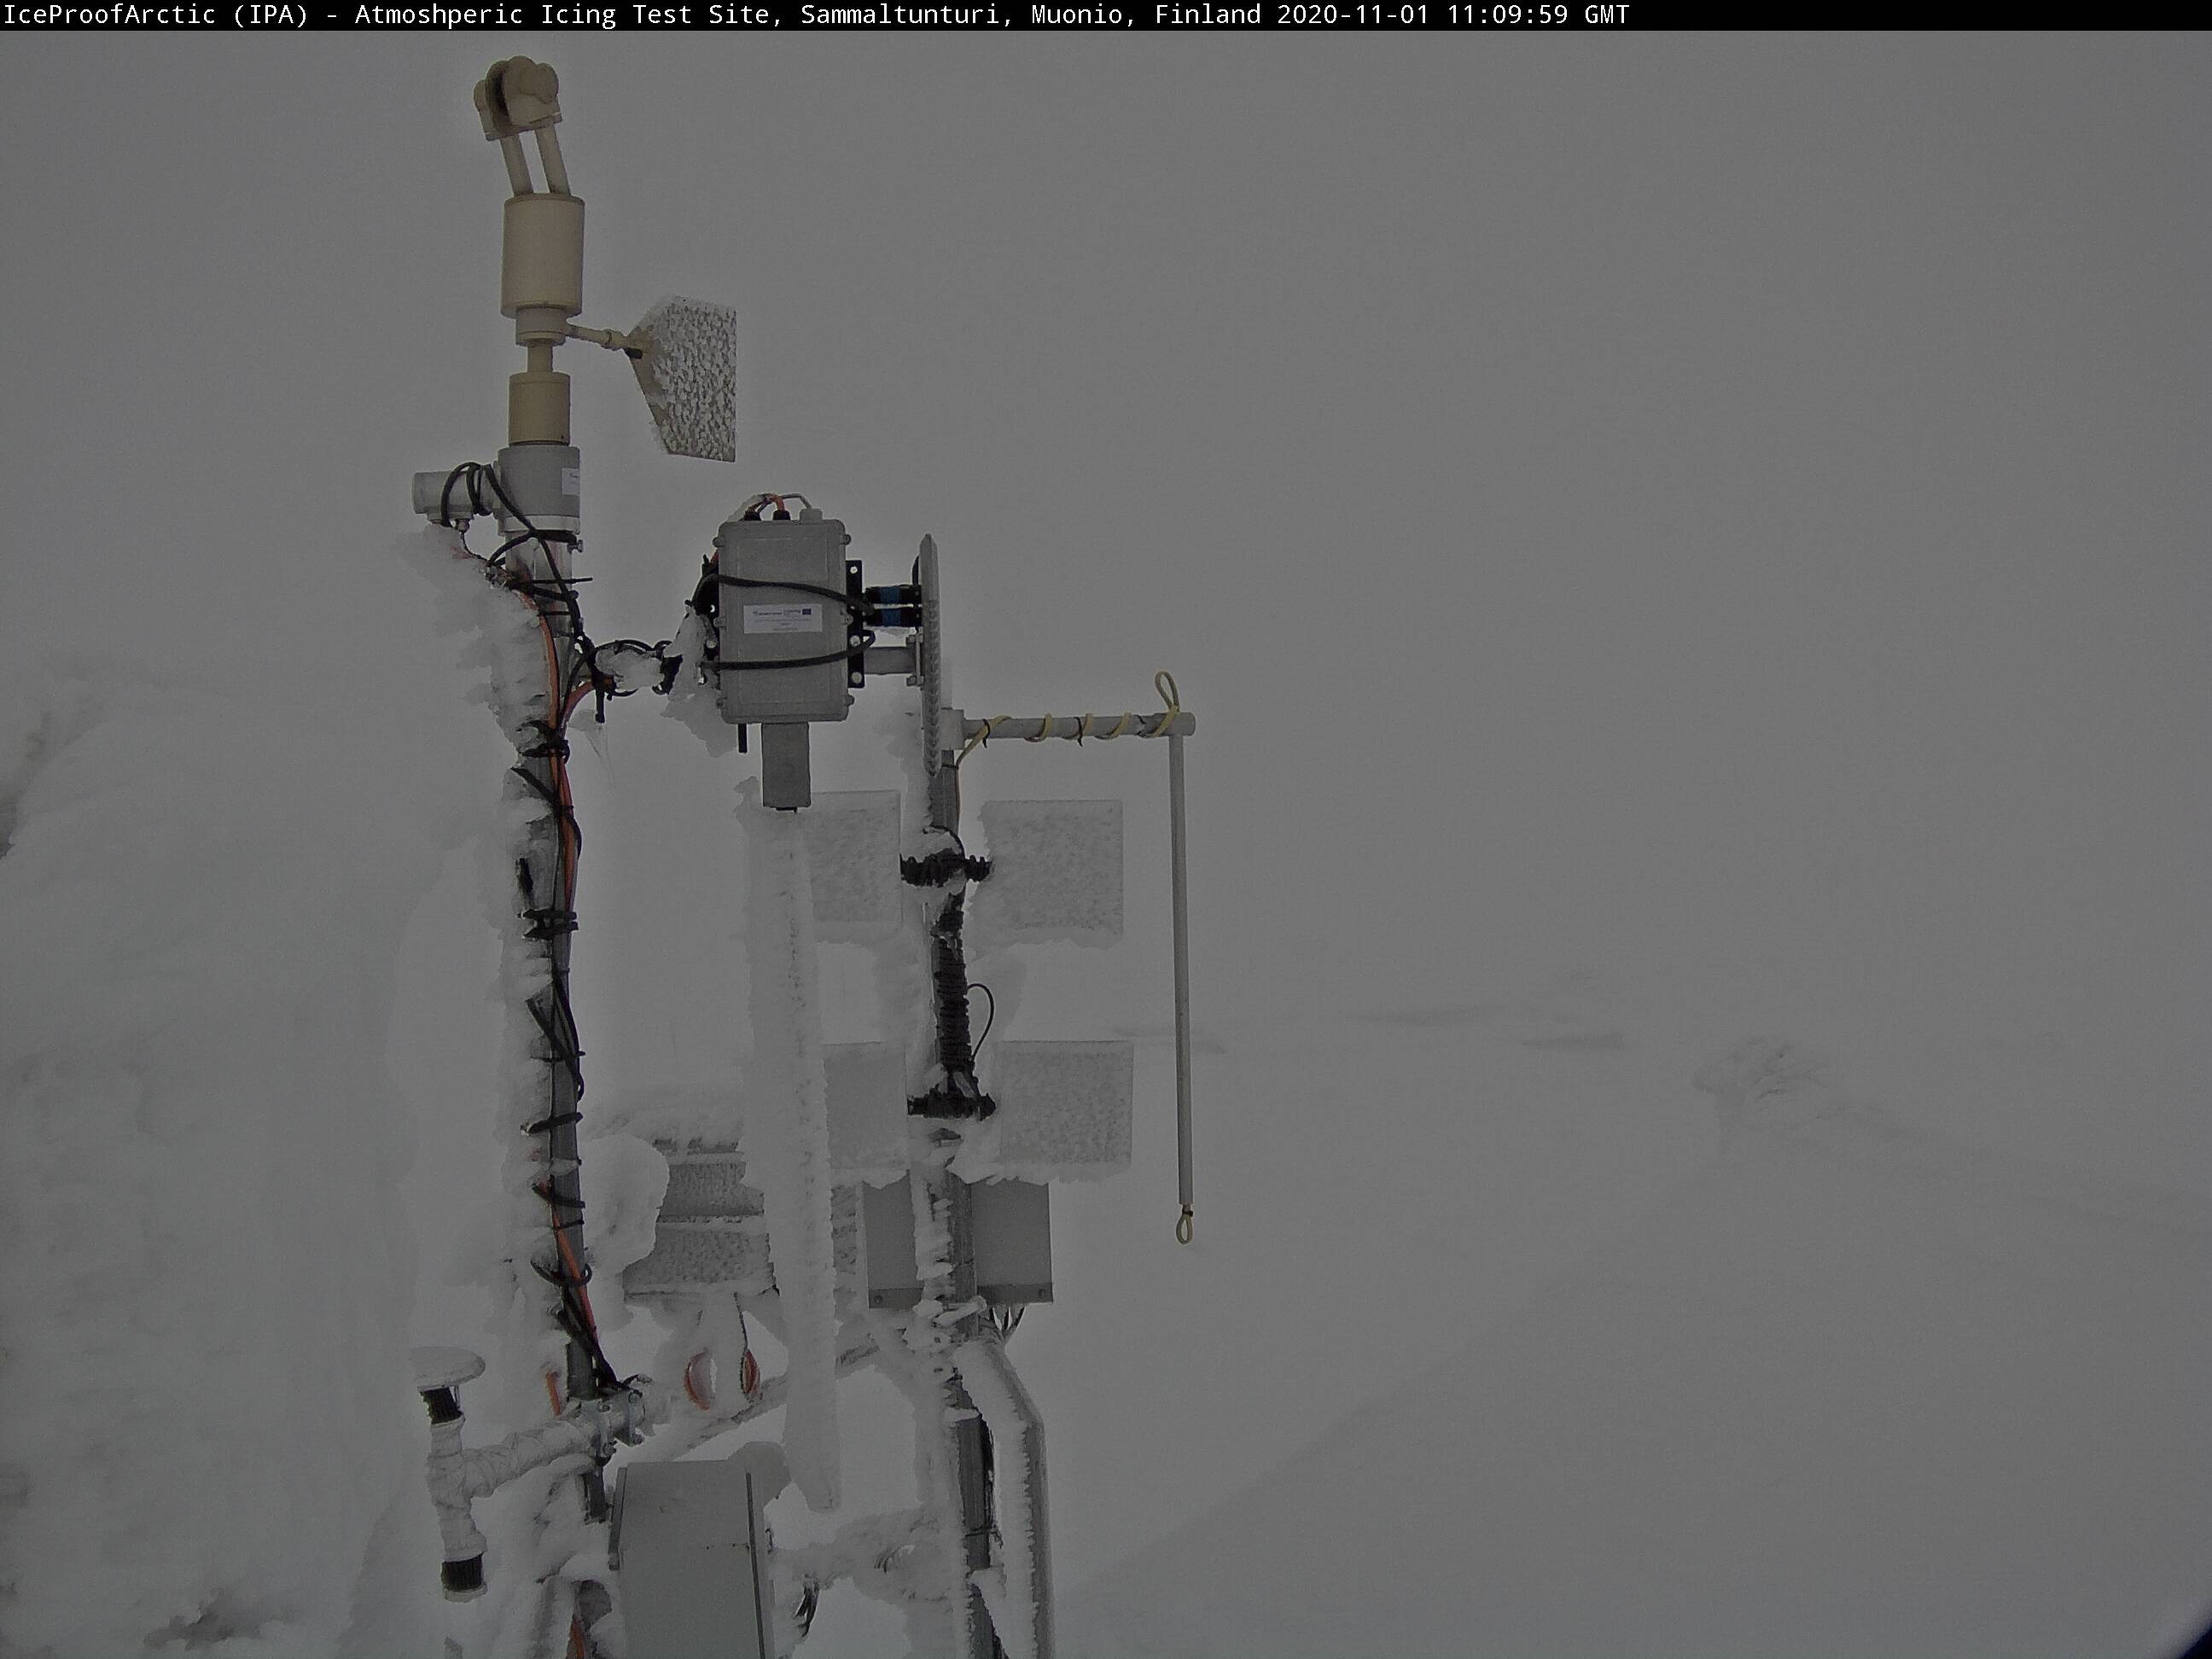
A severe atmospheric icing event was recorded on Sammaltunturi station in the autumn 2020. The two photos from the measurement site show the situation first before the icing event on 31st October, and the second photo after an icing event on 1st November. The two graphs show the measurement results from the icing cloud from the ICEMET sensor.
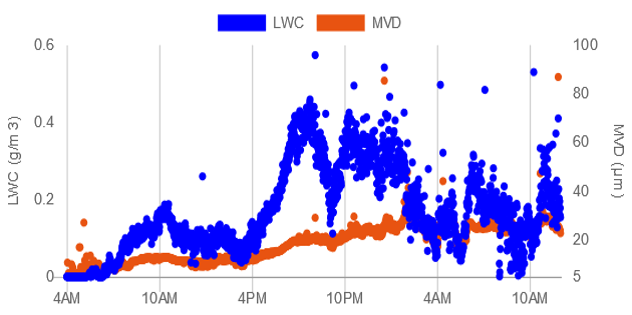
Icing cloud droplets measured by the ICEMET-sensor. On this image, the measured Liquid Water Content (LWC), [g/m3], is in blue color, which tells us how much there is water in liquid form is in the air. And the other measured parameter is Median Volume Diameter (MVD), in micrometers, which describes the size distribution of the cloud droplets.
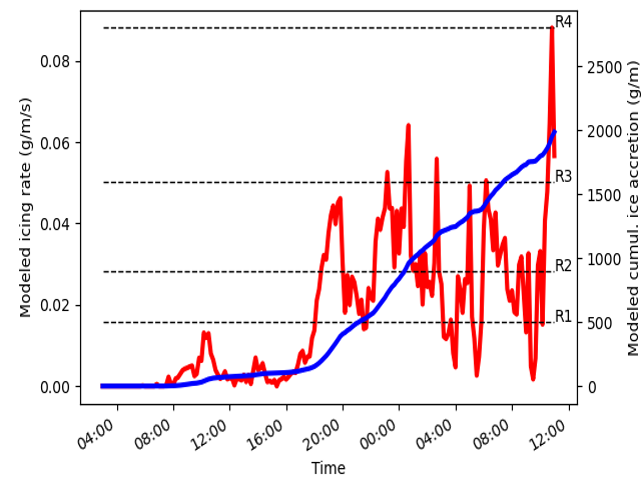
In this graph, the ICEMET droplet measurements have been combined with wind speed and temperature, to calculate the icing rate, [g/m/s], and the cumulative ice accretion, [g/m], for a 30 mm cylinder object. The R1 to R4 describe the different icing event severities of the accumulated ice load.
A timelapse video from another icing event in the video below. The ice accretion on the rotating cylinder (OLWI sensor, located close to the center in the video) is clearly visible.